
Good morning, and welcome to The Cargo Club!
Today is National Power Rangers Day, which feels like a good time to acknowledge that the Power Rangers had one of the least efficient workflows in television history.
Every episode followed roughly the same process:
Only at that point would somebody remember, “Wait, don’t we have five giant robot dinosaurs that combine into an even larger robot with a sword?”
Guys. Maybe lead with that.
If I have a Megazord, I’m not throwing a single punch myself. The second Rita Repulsa starts yelling from the moon, I’m already climbing into the robot. We can discuss teamwork and personal growth after I’m finished obliterating my enemies from the comfort of my air-conditioned kaiju killer.
For the record, my favorite was always the Blue Ranger. If the Red Ranger was your favorite, that’s fine. I’m just going to assume you’re also a Yankees, Cowboys, and Lakers fan.
Anyway, happy National Power Rangers Day. Remember, there’s no prize for making the problem harder than it needs to be. Sometimes the correct answer is the simplest one.
– Greyson Harris
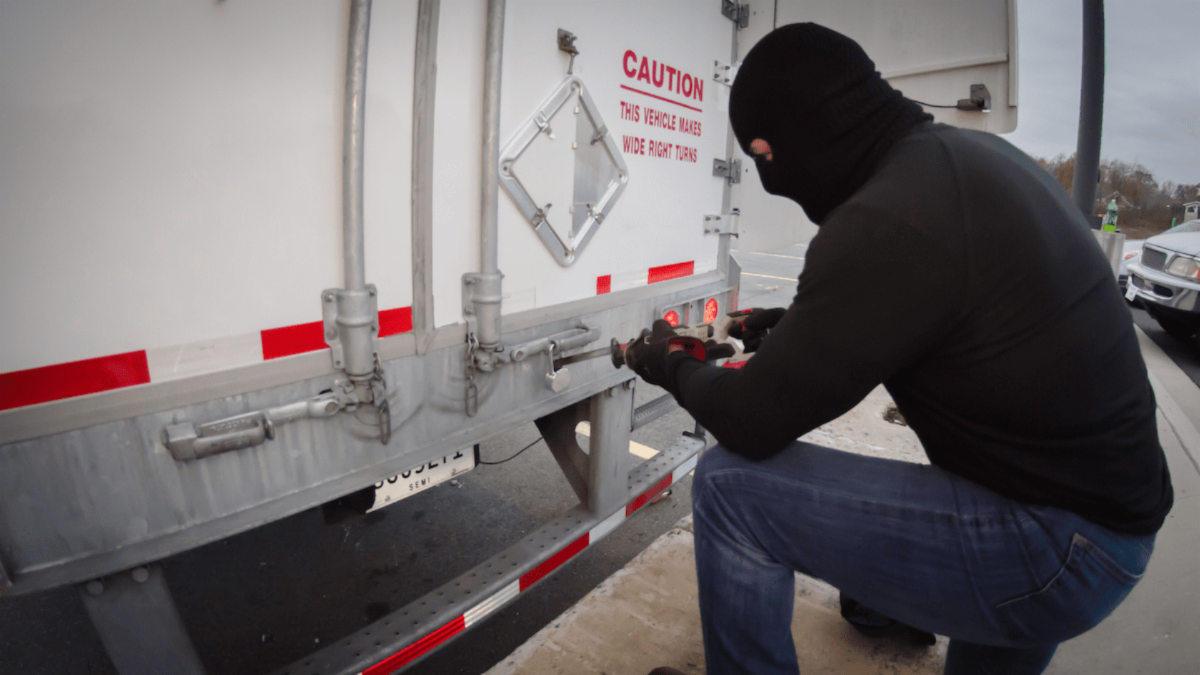
Cargo theft remained stubbornly high during the second quarter, with thieves targeting 605 reported loads across the U.S., according to a new report from cargo-security firm Overhaul.
Reported incidents increased 5% from the first quarter, although they were down 5% compared with the same period last year. Overhaul recorded an average of roughly 202 incidents per month from April through June, or nearly seven reported cargo thefts every day.
May was the busiest month, accounting for 35% of all second-quarter activity.
Once again, California and Texas were doing most of the heavy lifting in a category nobody wants to lead.
California continued to lead the country by a wide margin, accounting for 34% of reported incidents. Texas followed at 18%. The largest shares of reported theft came from:
Electronics were the most frequently targeted commodity in California, followed by food and beverages, clothing and shoes, and miscellaneous goods.
In Texas, thieves most frequently targeted home and garden products, electronics, and building and industrial materials.
Electric Booglaloo.
Electronics were the most frequently targeted commodity nationwide, accounting for 23% of reported cases.
But some of the biggest movement happened farther down the list:
Building and industrial freight also increased from both the previous quarter and the same period last year, meaning thieves aren’t limiting themselves to the obvious high-value targets.
Thieves also appear to have developed a preference for starting the weekend early. Friday accounted for 18% of incidents, the largest share of any day, while 28% occurred between midnight and 6 a.m.
Pesky pilferage.
Pilferage remained the most common type of cargo theft, accounting for nearly half of all reported incidents.
Other methods were spread across a mix of full-load and facility-based crimes:
Texas recorded the largest share of full truckload theft reports, while deceptive pickups remained a smaller, but increasingly important, piece of the overall picture.
Location data tells a similar story. Warehouses and distribution centers accounted for 37% of incidents where a site could be identified, while truck stops and fuel stations represented 15%, and rail locations made up 11%.
California, Tennessee, and Texas recorded most warehouse-related cases, while Illinois, California, Arizona, and Tennessee led rail theft reports.
Hollywood heist.
If the national numbers weren’t enough, Southern California continues to operate on an entirely different level.
Over the past 12 months, the region accounted for 37% of all reported cargo thefts in the U.S. A few numbers put that concentration into perspective:
Pilferage remained the most common method in Southern California at 45%, but deceptive pickups are becoming a bigger concern.
Those incidents increased from 24% to 28% of reported thefts in the region, while electronics, clothing and shoes, and food and beverages remained among the most frequently targeted commodities.
Overhaul cautioned that its data represents reported incidents rather than every cargo crime nationwide, and totals can rise later as additional information comes in.

The federal government is moving closer to testing a pair of programs that could eventually give truck drivers more control over how they structure their workdays.
FMCSA announced Thursday that it has completed pre-testing for its Flexible Sleeper Berth and Split Duty Period pilot programs and is now reviewing the results ahead of a planned full launch in 2027.
The basic idea is simple: give drivers more freedom to decide when they stop, rest, or wait, rather than forcing every workday into the same rigid clock.
The complicated part is figuring out whether that flexibility makes drivers safer or simply keeps them on duty longer.
If I could turn back time.
The more controversial of the two programs is the Split Duty Period Pilot, which would allow participating drivers to pause their 14-hour driving window for up to three hours per day.
That pause could include:
Under current hours-of-service rules, the 14-hour clock generally keeps ticking once a driver’s workday begins, even if that driver spends several hours sitting at a shipper, waiting out traffic, or parked because of bad weather.
FMCSA says the pilot could give drivers more control over those situations without forcing them to race the clock later in the day. The agency specifically cited heavy traffic, severe weather, detention, and voluntary rest breaks as situations where the added flexibility could help.
FMCSA said it also plans to monitor shippers for signs of increased detention or driver exploitation during the study.
Overtime or overworked?
Highway safety advocates aren’t convinced.
Advocates for Highway and Auto Safety argued during the public comment period that FMCSA should focus on reducing detention and driver coercion rather than giving carriers a way to stop the hours-of-service clock.
Their biggest concern is that the proposal could effectively stretch a driver’s workday from 14 hours to as many as 17. The group also questioned whether FMCSA has enough evidence to show that pausing the clock would actually reduce fatigue or improve safety.
Some carriers see it differently.
Werner Enterprises previously argued that more flexible work rules could improve safety by allowing drivers to stop when real-world conditions call for it instead of continuing to drive because an inflexible clock is working against them.
That could mean taking a longer break during rush hour, waiting out a storm, or simply stopping when a driver doesn’t feel comfortable continuing.
Sleeper build.
FMCSA’s second program would test more flexible ways for drivers to divide their required off-duty time. Participants in the Flexible Sleeper Berth Pilot would be allowed to split their rest into two periods in any combination, provided:
The goal is to determine whether drivers can safely structure their sleep around personal fatigue levels and operating conditions rather than relying on a narrower set of approved sleeper berth splits.
Coming soon…
Both programs have already gone through small-scale pre-tests.
The Split Duty Period test included nine drivers from three carriers in Minnesota, Wisconsin, and Ohio, while the sleeper berth test involved nine drivers from carriers in Ohio, Virginia, and Wisconsin.
Assuming FMCSA moves forward as planned, the full pilot programs will be considerably larger. Each study is expected to include 256 drivers, bringing total participation to 512. Drivers will remain in the programs for four months and can receive up to $1,600 for completing all study requirements.
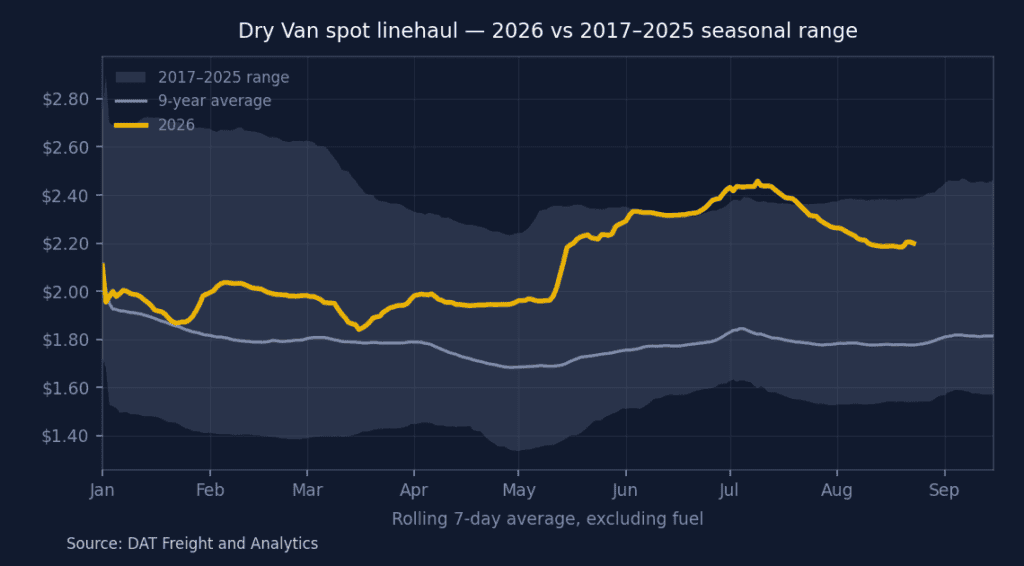
Dry van spot rates declined for the fourth consecutive week as late-summer freight volumes continued to soften, but tightening capacity kept market conditions significantly stronger than last year.
National dry van linehaul averaged $2.21 per mile, excluding fuel, down four cents from the previous week. Despite the decline, rates remained near the top of the historical range:
The 10 dry van bellwether states averaged $2.93 per mile outbound, down four cents week over week, but up 40.6%, or $0.85 per mile, year over year.
Those states accounted for 35.6% of outbound van loads, consistent with their recent share of the market. Most major origins softened as summer volumes slowed, although the Upper Atlantic bucked the trend with a 2.1% weekly increase.
Load postings were essentially unchanged from the previous week and remained 23.7% above last year. Truck postings, meanwhile, fell 2.4% week over week and 28.4% year over year.
With available equipment declining faster than freight demand, the load-to-truck ratio increased from 9.64 to 9.88. That remained well above the 5.72 ratio recorded during the same week last year.
DAT’s 35-day forecast projects dry van linehaul at $2.19 per mile in late September, roughly two cents below the current average. While the forecast carries a range of approximately seven cents in either direction, the projected rate would remain about $0.54 per mile higher than last year.
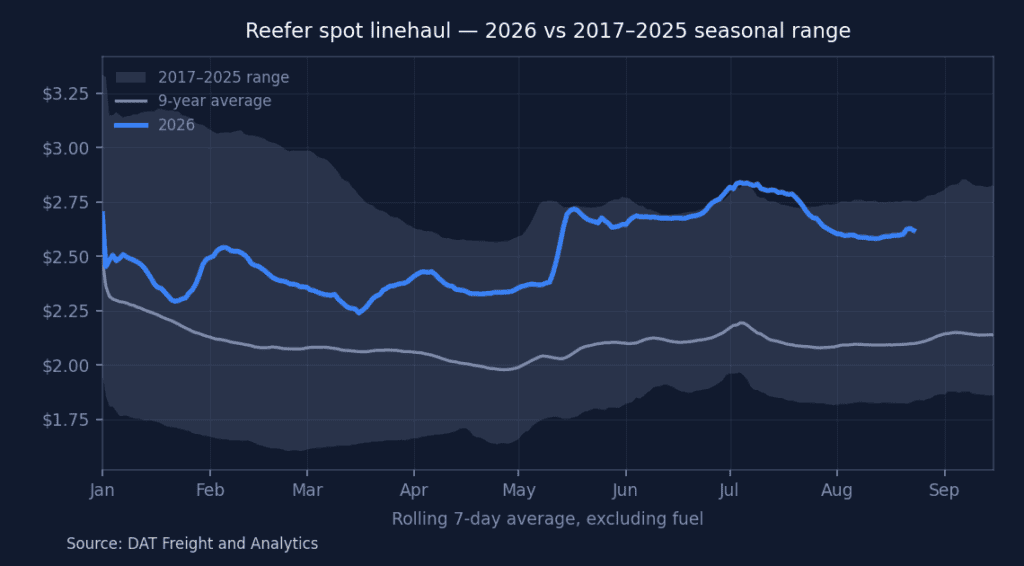
Reefer spot rates were nearly unchanged this week, but rising freight demand and shrinking truck supply pushed capacity conditions significantly tighter.
National reefer linehaul averaged $2.63 per mile, excluding fuel, down less than one cent from the previous week. Rates remained near the top of the historical range:
The 10 reefer bellwether states averaged $3.65 per mile outbound, up four cents week over week and $1.05 per mile year over year.
Those states accounted for 42.3% of outbound reefer loads, slightly above their typical range. The Upper Atlantic led major origins with a 2.3% weekly increase, while most other leading markets softened as summer volumes slowed.
Load postings increased 10.9% from the previous week and 38.6% year over year. Truck postings moved in the opposite direction, falling 5.2% week over week and 31.3% from last year.
That imbalance pushed the load-to-truck ratio from 18.03 to 21.10. The ratio has now more than doubled from 10.45 during the same week last year.
DAT’s 35-day forecast projects reefer linehaul at $2.59 per mile in late September, approximately four cents below the current average. Even with the expected seasonal decline, rates would remain about $0.58 per mile higher than last year.
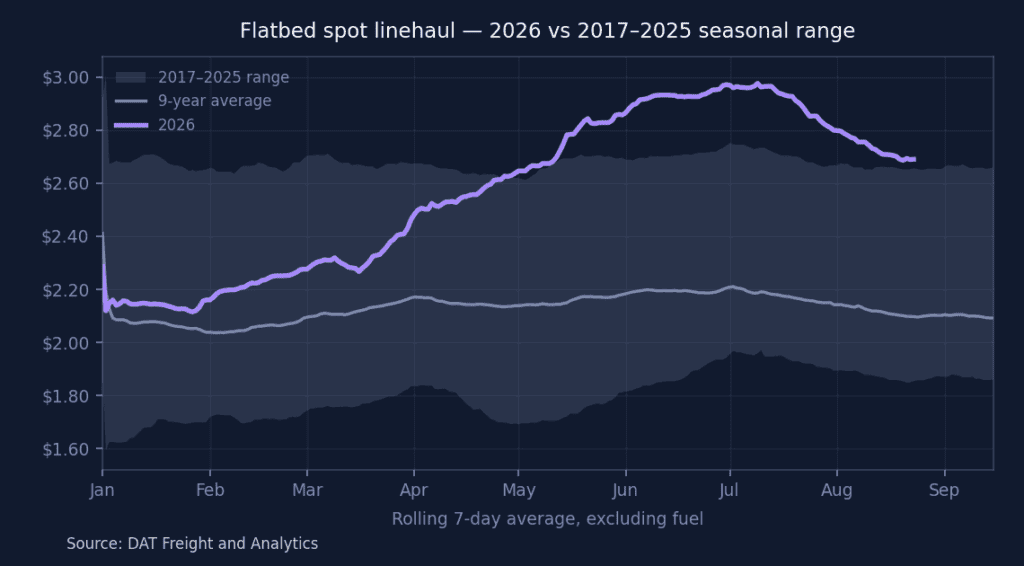
Flatbed spot rates declined slightly this week as summer volumes softened, but rising load postings and shrinking truck supply continued to tighten capacity.
National flatbed linehaul averaged $2.70 per mile, excluding fuel, down two cents from the previous week. Despite the decline, rates remained near the top of the historical range:
The 10 flatbed bellwether states averaged $3.37 per mile outbound, down four cents week over week, but up 34%, or $0.85 per mile, year over year.
Those states accounted for 52.4% of outbound flatbed loads, consistent with their recent share of the market. Most major origins declined as summer volumes eased, although the Upper Atlantic posted a 3.9% weekly increase.
Load postings increased 2.6% from the previous week and 30.1% year over year. Truck postings fell 5.4% week over week and 26.3% from last year.
That imbalance pushed the load-to-truck ratio from 33.31 to 36.11, well above the 20.44 recorded during the same week last year.
DAT’s 35-day forecast projects flatbed linehaul at $2.65 per mile in late September, approximately five cents below the current average. Despite the expected pullback, rates would remain about $0.61 per mile higher than last year.

KCH is teaming up with Truck Parking Club to help drivers find safe, legal parking, without the scavenger hunt.
Use code KCH25 at checkout for $25 off your next reservation.
Less time circling the lot. More time doing literally anything else.

We’re now posting freight on the Trusted Freight Exchange (TFX), a secure, Highway-powered network made for verified carriers like you.
It’s built right into Highway, free to use, and designed to connect you with quality freight fast.
Every KCH load on TFX is:
With TFX, you skip the back-and-forth and get straight to hauling.
Designed for shippers who want straightforward market insight and smarter freight strategies.