


Good morning, and welcome to The Cargo Club!
The wait is finally over.
After six long months wandering through the featureless desert of football purgatory, surviving on spring games, recruiting rumors, and whatever scraps the transfer portal coughed up, college football is officially back.
It’s that special time of year when regional tribalism, institutional pride, and crippling gambling addictions collide in the beautiful melting pot we call tradition.
Nothing says “we’re so back” quite like gathering with 90,000 of your closest friends in 100-degree heat to watch a roster somehow composed of kids who attended prom four months ago and grown men who have been playing college football since the Obama administration.
That’s right. Somewhere on that field is an 18-year-old freshman lining up across from a 27-year-old with a wife, two kids, a master’s degree, and one final season of eligibility because he redshirted during a lunar eclipse in 2021.
Sure, there are questions:
Those all sound like excellent topics for Sunday.
In the meantime, otherwise reasonable adults will spend their Saturdays screaming at 20-year-olds, debating strength of schedule with the intensity of constitutional scholars, and developing deep personal resentment toward universities they have never visited while simultaneously cheering for institutions that they never attended.
Ladies and gentlemen, we made it. Enjoy your college football weekend.
Oh yeah, and happy Labor Day weekend too, I guess.
– Greyson Harris
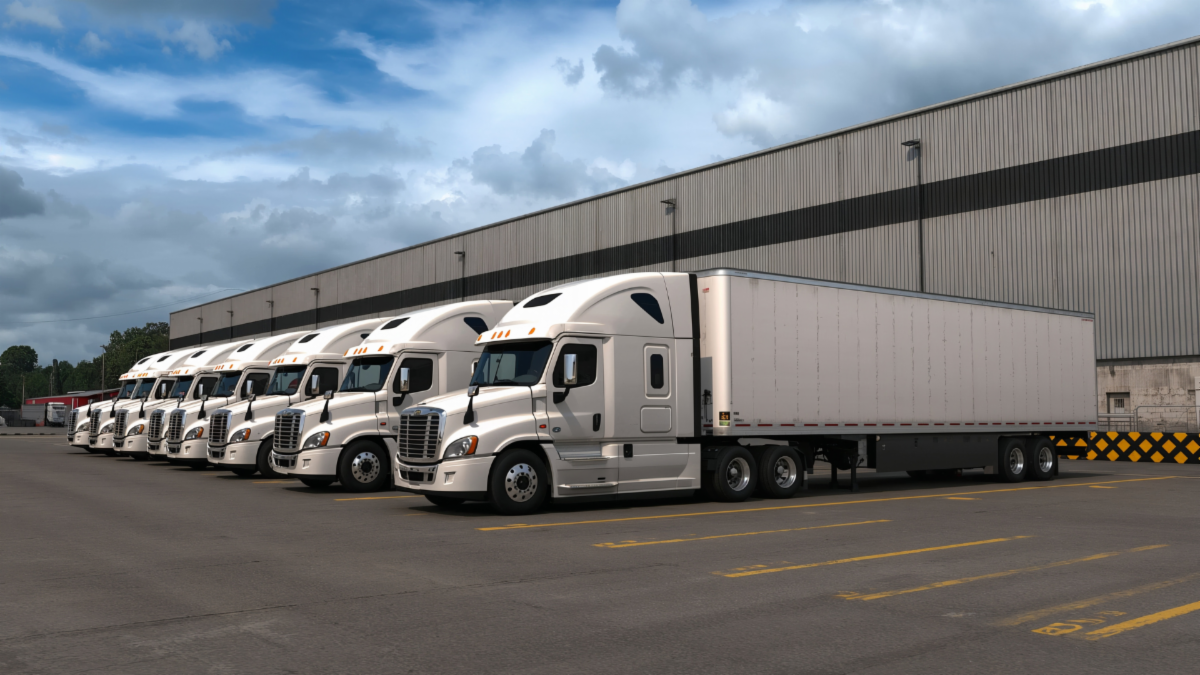
North American Class 8 truck orders stayed elevated in August as fleets continued securing equipment ahead of stricter emissions rules, even as the industry reached the awkward handoff between the 2026 and 2027 model years.
FTR Transportation Intelligence reported preliminary net orders of 18,200 units for the month, down 19% from July but still 42% higher than August 2025.
Still truckin’.
Despite the August slowdown, 2026 has been an unusually strong year for heavy-duty truck demand.
Through August, Class 8 orders were:
FTR cautioned against treating August’s month-over-month decline as a sign that demand is falling apart. Some manufacturers may have sold out their remaining 2026 production slots by early or mid-August, while their 2027 order books had not yet opened.
That left fleets in a bit of equipment-ordering purgatory: too late for the old trucks, too early for the new ones.
Upgrade or get left behind.
The industry’s rush to secure current-generation engines also appears to be wrapping up.
FTR said most, if not all, surcharge-free 2026 engine production slots are likely filled, effectively ending the EPA 2027 NOx pre-buy that has helped prop up orders throughout the year. September should provide a clearer picture of underlying demand as manufacturers begin opening their 2027 order books.
Of course, once those books open, fleets get to move on to everyone’s favorite part of buying equipment: finding out how much more it costs.
FTR estimates that manufacturers using noncompliance penalties to continue selling engines above the new NOx limit could face costs of roughly $6,000 to $7,000 per engine, expenses that would likely be passed along to buyers.
Fully EPA 2027-compliant engines could carry an estimated manufacturer upcharge of $8,000 to $12,000.
Manufacturers are expected to take different approaches to the transition. Some may offer fleets a choice between fully compliant engines and current-generation models carrying a penalty, while at least one manufacturer is expected to offer only the fully compliant option.
Pre-loved trucks.
The used Class 8 market, meanwhile, showed some signs of losing momentum in July.
ACT Research reported same-dealer retail sales fell 2.5% from June, a larger decline than typically expected from seasonal trends. Even so, demand remained considerably stronger than a year ago, with July sales running 45% above the same month in 2025.
Average retail prices also softened, falling 4% from June to $60,986. Through July, same-dealer used Class 8 sales were still up 10% year over year, while average prices were 3% higher.

The U.S. trade deficit widened sharply in July as American companies continued their extremely casual, definitely inexpensive quest to buy enough computers, chips, and technology equipment to power the AI boom.
The goods and services deficit jumped 24.4% from June to $88.6 billion, its largest level since early 2025. Imports climbed 2.8% to $399.3 billion, while exports fell 2.1% to $310.7 billion.
The future is now.
The biggest culprit was capital goods, where imports surged 11.4%, the largest monthly increase since 1993.
That category includes computers, accessories, semiconductors, telecommunications equipment, and much of the hardware currently being shoveled into America’s AI infrastructure at remarkable speed.
Computer accessory imports alone increased by a record $6.6 billion, while inbound shipments of computers, semiconductors, and telecommunications equipment also rose. Total capital goods imports reached a record $140.3 billion in July.
Nothing’s leaving.
Unfortunately, while America was filling its shopping cart, fewer goods were heading in the other direction.
Exports declined by $6.6 billion from June, with outbound shipments of industrial supplies, including crude oil and petroleum products, falling during the month. Nonmonetary gold exports also dropped, continuing a stretch of particularly volatile trade in the category.
Combined with the surge in imports, that was enough to push the goods deficit up by $17.6 billion to $119.6 billion.
Spreadsheet nightmare.
The widening trade gap could also become a headache for third-quarter economic growth.
Before the July data arrived, the Federal Reserve Bank of Atlanta’s GDPNow forecast estimated that net exports would subtract 1.34 percentage points from third-quarter GDP growth, potentially the biggest trade-related drag since early 2025.
On an inflation-adjusted basis, the merchandise trade deficit widened to $106.4 billion in July.
The deficit with Mexico also reached a record, while the gap with Canada narrowed. The U.S. deficit with China was little changed, and the shortfall with Vietnam widened as supply chains continued shifting toward the Southeast Asian manufacturing hub.
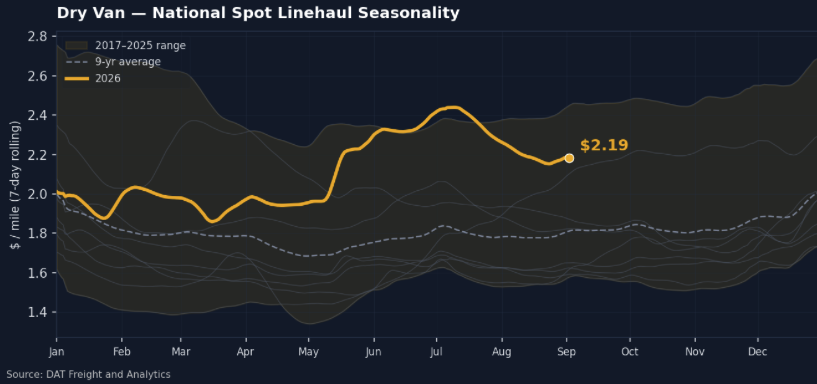
Dry van spot rates slipped slightly this week, but underlying market conditions tightened as freight demand increased and available capacity continued to fall.
National dry van linehaul averaged $2.19 per mile, down two cents, or 0.8%, from the prior week. Even after the decline, rates remained near the top of the historical range:
The 10 dry van bellwether states averaged $2.93 per mile outbound, up two cents, or 0.7%, from the previous week and 37.9% higher than a year ago.
Those states accounted for 35.7% of all outbound dry van loads, right in line with their recent baseline.
Regional performance was mixed, but the Lower Atlantic led the major origins with a 2.1% week-over-week increase, followed closely by the Upper Atlantic at 2%.
Most other leading regions softened as summer freight volumes continued to cool. South Central posted the largest decline at 4.1%, while Florida and South Georgia remained the lowest-priced major origin at $1.49 per mile.
The top 10 origins still accounted for 87.8% of all U.S. outbound loads moved during the week.
The more interesting movement came underneath the rate number.
Load postings increased 12.3% week over week and now sit 22.2% above last year. Truck postings moved the opposite direction, falling 10% from the prior week and sitting 31.9% below year-ago levels.
That combination pushed the dry van load-to-truck ratio to 12.01, up sharply from 9.62 last week and well above the 6.69 recorded during the same period in 2025.
DAT’s 35-day forecast calls for dry van spot linehaul to average roughly $2.15 per mile in early October, with an uncertainty range of about eight cents in either direction.
That would represent only a modest decline from current levels and would still leave rates roughly $0.46 per mile above the $1.69 recorded around the same time last year.
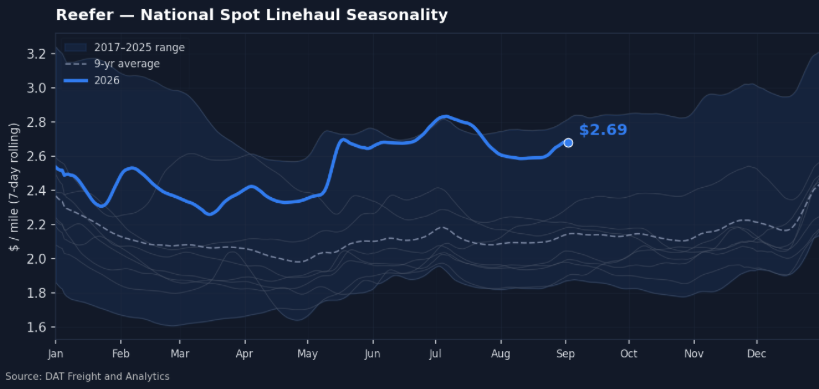
Reefer spot rates climbed this week as stronger freight demand collided with another decline in available capacity.
National reefer linehaul averaged $2.69 per mile, up six cents, or 2.1%, from the prior week. Rates remained near the top of the historical range:
The 10 reefer bellwether states averaged $3.67 per mile outbound, also up six cents from the previous week and 37.6% higher than a year ago.
Those states accounted for 41.3% of all outbound reefer loads, near the upper end of their typical 38% to 42% range.
Regional strength was concentrated across several northern markets. The Pacific Northwest posted the largest week-over-week increase at 5.7%, followed by the Upper Midwest at 3.9%, and the Great Lakes at 2.8%.
Southern markets were softer, with South Central rates down 3.9% and the Southeast down 2.5%.
The top 10 origins accounted for 84.3% of all U.S. outbound reefer loads during the week.
The bigger story continues to be the shrinking supply of available trucks.
Reefer load postings increased 4.7% week over week and now sit 26.5% above last year. Truck postings fell 8.7% from the prior week and are 31.8% below year-ago levels.
That imbalance pushed the reefer load-to-truck ratio to 23.55, up from 20.55 last week and nearly double the 12.71 recorded during the same period in 2025.
Unlike dry van, reefer rates moved higher alongside the tightening capacity picture this week.
Freight demand is running well ahead of last year, available equipment continues to thin, and the load-to-truck ratio remains exceptionally elevated.
That leaves reefer carriers heading into September with considerably more leverage than they had a year ago, while shippers continue navigating a market where finding a truck is becoming easier said than done.
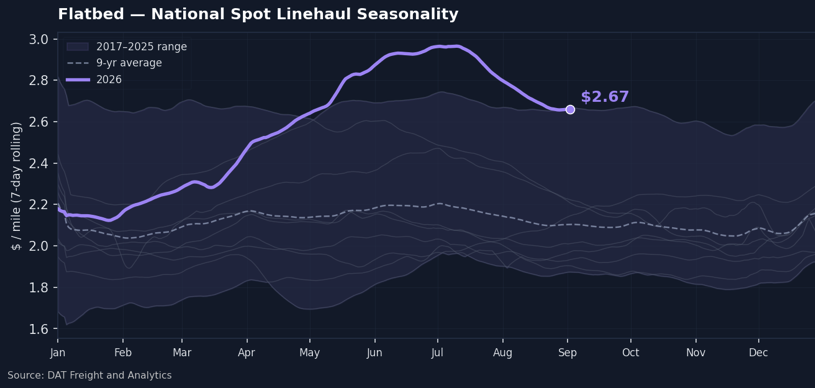
Flatbed spot rates slipped again this week, but the underlying market continued to tighten as freight demand increased and available capacity pulled back sharply.
National flatbed linehaul averaged $2.67 per mile, down three cents, or 1.2%, from the prior week. Even after the decline, rates remained near the top of the historical range:
The 10 flatbed bellwether states averaged $3.32 per mile outbound, down three cents, or 0.9%, from the previous week but still 31.5% higher than a year ago.
Those states accounted for 52.2% of all outbound flatbed loads, right in line with their normal 51% to 53% range.
Most major origins moved lower during the week. South Central posted the largest decline at 4.3%, followed by California at 3.2%, and the Lower Midwest at 2.8%.
Florida and South Georgia was the rare exception, rising 1%, while the Great Lakes managed a modest 0.3% gain.
The Southeast remained the highest-priced major origin at $3.27 per mile, followed by the Ohio River region at $3.21.
The more important movement came from the balance between freight and available trucks.
Flatbed load postings increased 8.8% week over week and now sit 43.5% above last year. Truck postings moved sharply in the opposite direction, falling 8.8% from the prior week and 27.1% year over year.
That pushed the flatbed load-to-truck ratio to 41.84, up from 35.09 last week and nearly double the 21.27 recorded during the same period in 2025.
So while rates gave back another three cents, there are now considerably more loads competing for considerably fewer trucks. The math is beginning to get a little uncomfortable for shippers.
DAT’s 35-day forecast calls for flatbed spot linehaul to average roughly $2.65 per mile in early October, with an uncertainty range of about seven cents in either direction.
That would leave rates essentially flat from current levels and roughly $0.58 per mile above the $2.07 recorded around the same time last year.

KCH is teaming up with Truck Parking Club to help drivers find safe, legal parking, without the scavenger hunt.
Use code KCH25 at checkout for $25 off your next reservation.
Less time circling the lot. More time doing literally anything else.

We’re now posting freight on the Trusted Freight Exchange (TFX), a secure, Highway-powered network made for verified carriers like you.
It’s built right into Highway, free to use, and designed to connect you with quality freight fast.
Every KCH load on TFX is:
With TFX, you skip the back-and-forth and get straight to hauling.
Designed for shippers who want straightforward market insight and smarter freight strategies.